How does real time PCR work? It reads fluorescence in every cycle, and the cycle where the signal crosses a threshold shows how much target the sample started with. Conventional PCR only confirms that something amplified.
Readers who want the wider field first can start with what is biotechnology. The basic copying reaction is explained in How PCR Works: The Step‑By‑Step Guide To DNA Amplification (2026 Explained) – Biolifetechnologies. This guide covers what happens on top of that reaction: how the signal is generated, how the Ct value is read, and how it becomes a quantity.
How the signal builds, cycle by cycle
Real-time PCR runs the same copying reaction as conventional PCR but adds a fluorescent reporter, so the instrument can watch product accumulate. EMBL-EBI training material explains that the amount of fluorescence is proportional to the amount of PCR product, and the result is fluorescence plotted against cycle number. Fluorescence is monitored through the whole run, across all 30 to 45 cycles, according to Biosistemika’s qPCR primer. Measuring in every cycle also greatly increases the reaction’s dynamic range, as QIAGEN’s bench guide notes.
A common misunderstanding is that the final brightness is the answer. The useful information is timing. A sample that contains more target shows fluorescence in earlier cycles, so the curve for a rich sample rises sooner than the curve for a dilute one. EMBL-EBI describes the time point at which fluorescence reaches a defined threshold as relative to the level of gene expression. That threshold-crossing point is the Ct value, covered in detail below.
Real-time PCR versus conventional PCR
The difference is when and how the product is measured. Conventional PCR is an end-point method: amplified DNA can only be detected after amplification has been carried out. Real-time PCR uses the kinetics of the reaction, so the quantity is read while amplification is still under way, and it gives relative or absolute amounts of amplified DNA.
| Feature | Conventional PCR | Real-time PCR | Planning use |
|---|---|---|---|
| When product is detected | After amplification has finished (end-point) | During the run, with fluorescence monitored across all 30 to 45 cycles | Choose real-time PCR when the shape and timing of amplification matter, not just the final result. |
| Type of result | Detection of amplified DNA | Quantitative: relative or absolute amounts of amplified DNA | Choose real-time PCR when the question is how much target is present. |
| Instrument cost | Standard thermal cycler | Five to ten times more expensive than a conventional thermal cycler | If a yes/no end-point is enough, a conventional cycler avoids the extra equipment cost. |
Figures come from Biosistemika and the endpoint-versus-kinetics distinction from Enzo Life Sciences.
Quantification here is fine-grained: Biosistemika reports that real-time PCR can distinguish two-fold differences in the quantity of target DNA molecules. If you are comparing PCR formats more widely, a related method is covered in How Digital PCR Works: A Clear, Practical Guide for 2026 – Biolifetechnologies.
Dyes and probes: where the fluorescence comes from
Fluorescence has to be tied to product formation, and two chemistries do this. A dye reports any double-stranded DNA, while a probe reports only its own target. The choice affects specificity, how many targets you can read per tube, and how much trust you can place in the curve.
SYBR Green and other intercalating dyes
SYBR Green is a dye that fluoresces only when bound to double-stranded DNA, so the signal grows as copies accumulate (EMBL-EBI). Its excitation and emission maxima are at 494 nm and 521 nm, respectively, per QIAGEN. The trade-off is that a dye cannot tell products apart: nonspecific PCR products and primer dimers can also add to the fluorescent signal. Dye-based reactions therefore depend on a highly specific primer pair, and a curve that rises early is not proof that the intended product formed.
TaqMan-style fluorescent probes
A probe carries a reporter and a quencher. During extension the probe is degraded, which releases the reporter and lets it fluoresce (EMBL-EBI). QIAGEN specifies that the cleavage comes from the exonuclease activity of Taq DNA polymerase, which separates the fluorophore from the quencher. Because the signal depends on the probe binding its own target sequence, it is more specific than a dye. Probes with different coloured reporters can also be combined in multiplex assays, detecting two or more amplicons in the same reaction.
Choosing between them
- Dye suits single-target work. Enzo notes that dye-based qPCR can examine only one target at a time, so it fits a simple question with a well-behaved primer pair.
- Probes suit diagnostic-style assays. The same source says probe-based qPCR is more specific than dye-based qPCR and is often the technology used for diagnostic assays.
- Multiplexing means probes. If you want several targets in one tube, plan for reporters of different colours from the start.
Reading Ct values and turning them into quantities
What a Ct value is
The Ct value is the cycle at which fluorescence first crosses the defined threshold. Biosistemika calls the same readout the quantitation cycle, Cq for short, so Ct and Cq can be treated as the same number under different names. The relationship runs backwards from what many people expect: lower Cq values mean higher initial copy numbers of the target.
- Lower Ct means more starting target. A sample that crosses the threshold early started with more template than one that crosses late.
- Ct is a cycle number, not an amount. It has to be translated into a quantity. Biosistemika describes ways of translating Cq values into absolute or relative copy numbers.
- Ct is only comparable under the same conditions. The threshold is a defined level, so Ct values are most meaningful when samples are run and analysed together with the same settings.
Standard curves and absolute versus relative results
A standard curve is the usual route to an absolute result. You run reactions of known target amount, plot their Ct values against those amounts, and read sample quantities from the same relationship. Biosistemika reports that quantification of this kind can be performed over several orders of magnitude. A relative result instead compares samples with each other, which is how expression changes between conditions are normally expressed. Choose absolute quantification when you need a copy number, and relative quantification when the question is whether a gene is higher or lower in one sample than in another.
Running an assay: preparation, setup and controls
A real-time run has four stages: prepare the sample, assemble the reaction, cycle with fluorescence reading, and review the data. Most errors in interpretation come from skipping the last step, so the controls described below matter as much as the curves.
Sample preparation
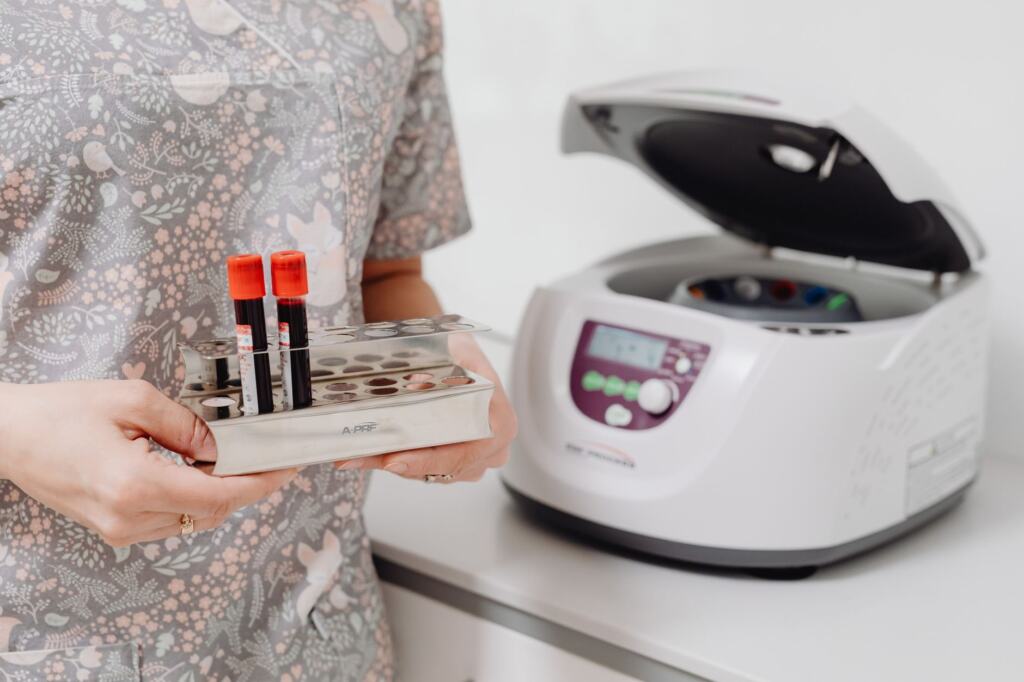
The reaction needs purified nucleic acid as its template, so samples are prepared and extracted before any reagents are combined. The image below is a stock illustration of a tube rack and benchtop centrifuge, the kind of equipment used at this stage.
Setup, cycling and review
Once template is ready, the reaction is assembled and loaded into the instrument, which then handles the cycling and the fluorescence readings automatically.
- Assemble the reaction. Combine template with polymerase, primers and either a dye or a probe.
- Load and run. The instrument cycles and records fluorescence through the run.
- Check the controls. Biosistemika states that several control reactions, such as a no-template control and a buffer control, need to be included in each run.
- Read the curves. Inspect the amplification plot, then take Ct values from the samples whose controls behaved as expected.
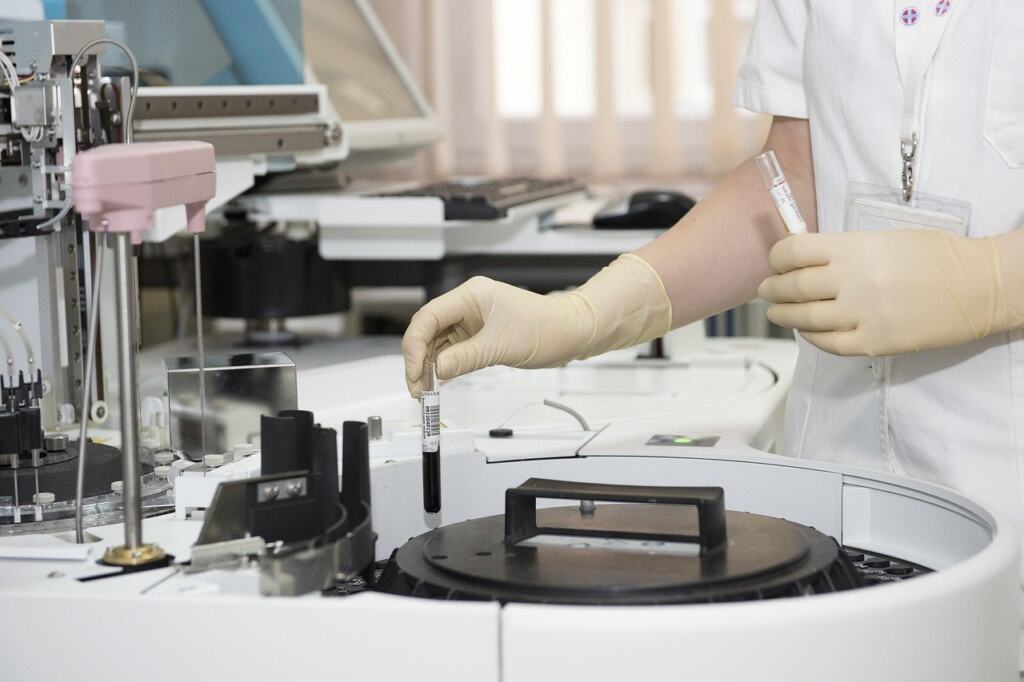
Treat a run with a failed control as unusable for interpretation and repeat it, because signal in a no-template well means the sample curves cannot be trusted at face value.
Where real-time PCR fits best
EMBL-EBI notes that real-time PCR is commonly used to measure gene expression, and that it is best suited to small gene subsets. That makes it a strong choice when you already know which genes you care about and want a sensitive, quantitative answer on them. When the aim is to survey a large number of genes at once, a method designed for breadth is the better fit, and real-time PCR then works best as a follow-up to confirm a short list of results.
Frequently asked questions
| Question | Answer |
|---|---|
| Is real-time PCR the same as qPCR? | Yes. Enzo lists real-time PCR as an alternative name for quantitative PCR, so the two terms describe the same method. |
| Can I use it if the target sequence is unknown? | No. EMBL-EBI states that the sequence of the specific target gene of interest must be known, because primers are designed against it. |
| How does it compare with microarrays for expression work? | Real-time PCR is more sensitive than microarrays at detecting small changes in expression, but it requires more input RNA and suits fewer genes at a time, according to EMBL-EBI. |